Appearance
Quick Start
Get your first site monitored from the Console in a couple of minutes. No terminal, no config files, no credit card.
1. Sign in
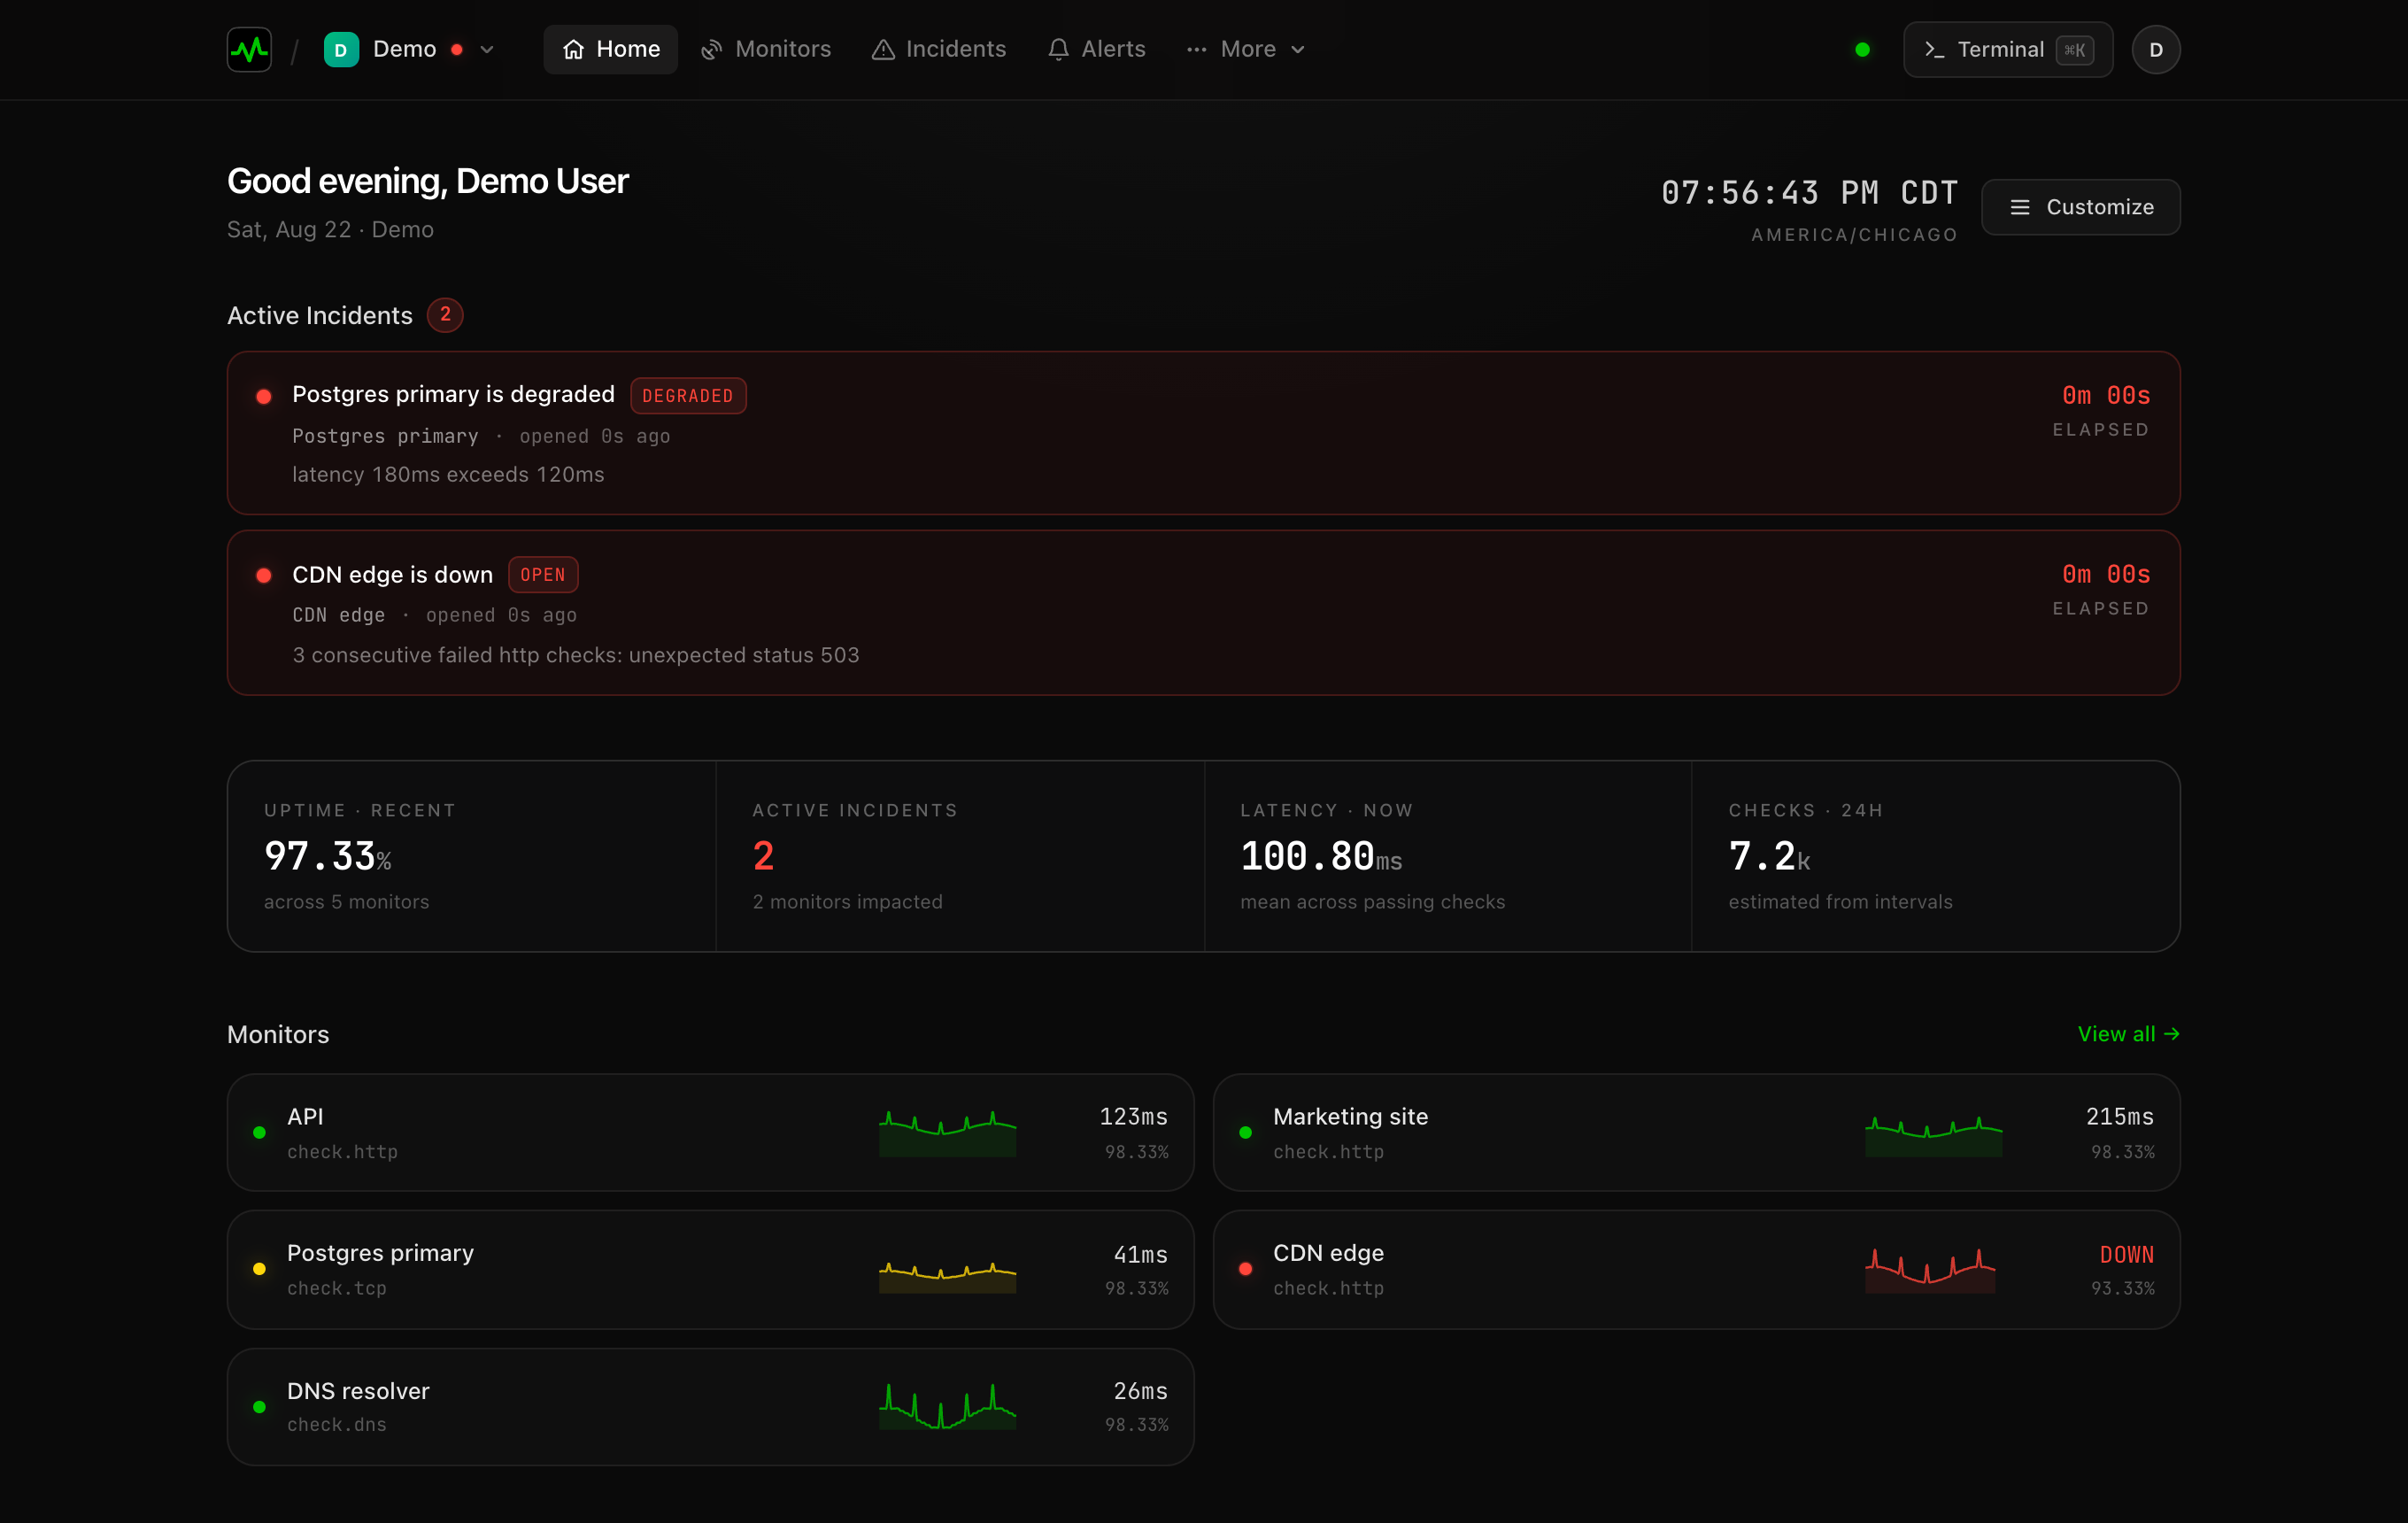
Open the Console and sign in with email or Sign in with Apple. You'll land on your dashboard: active incidents up top, a live overview, and your monitors below.
2. Add your first monitor
Hit New monitor, paste your site's URL, and create it. The URL is the only required field. Latency picks a sensible check type and starts checking it every 30 seconds from regions around the world, right away.
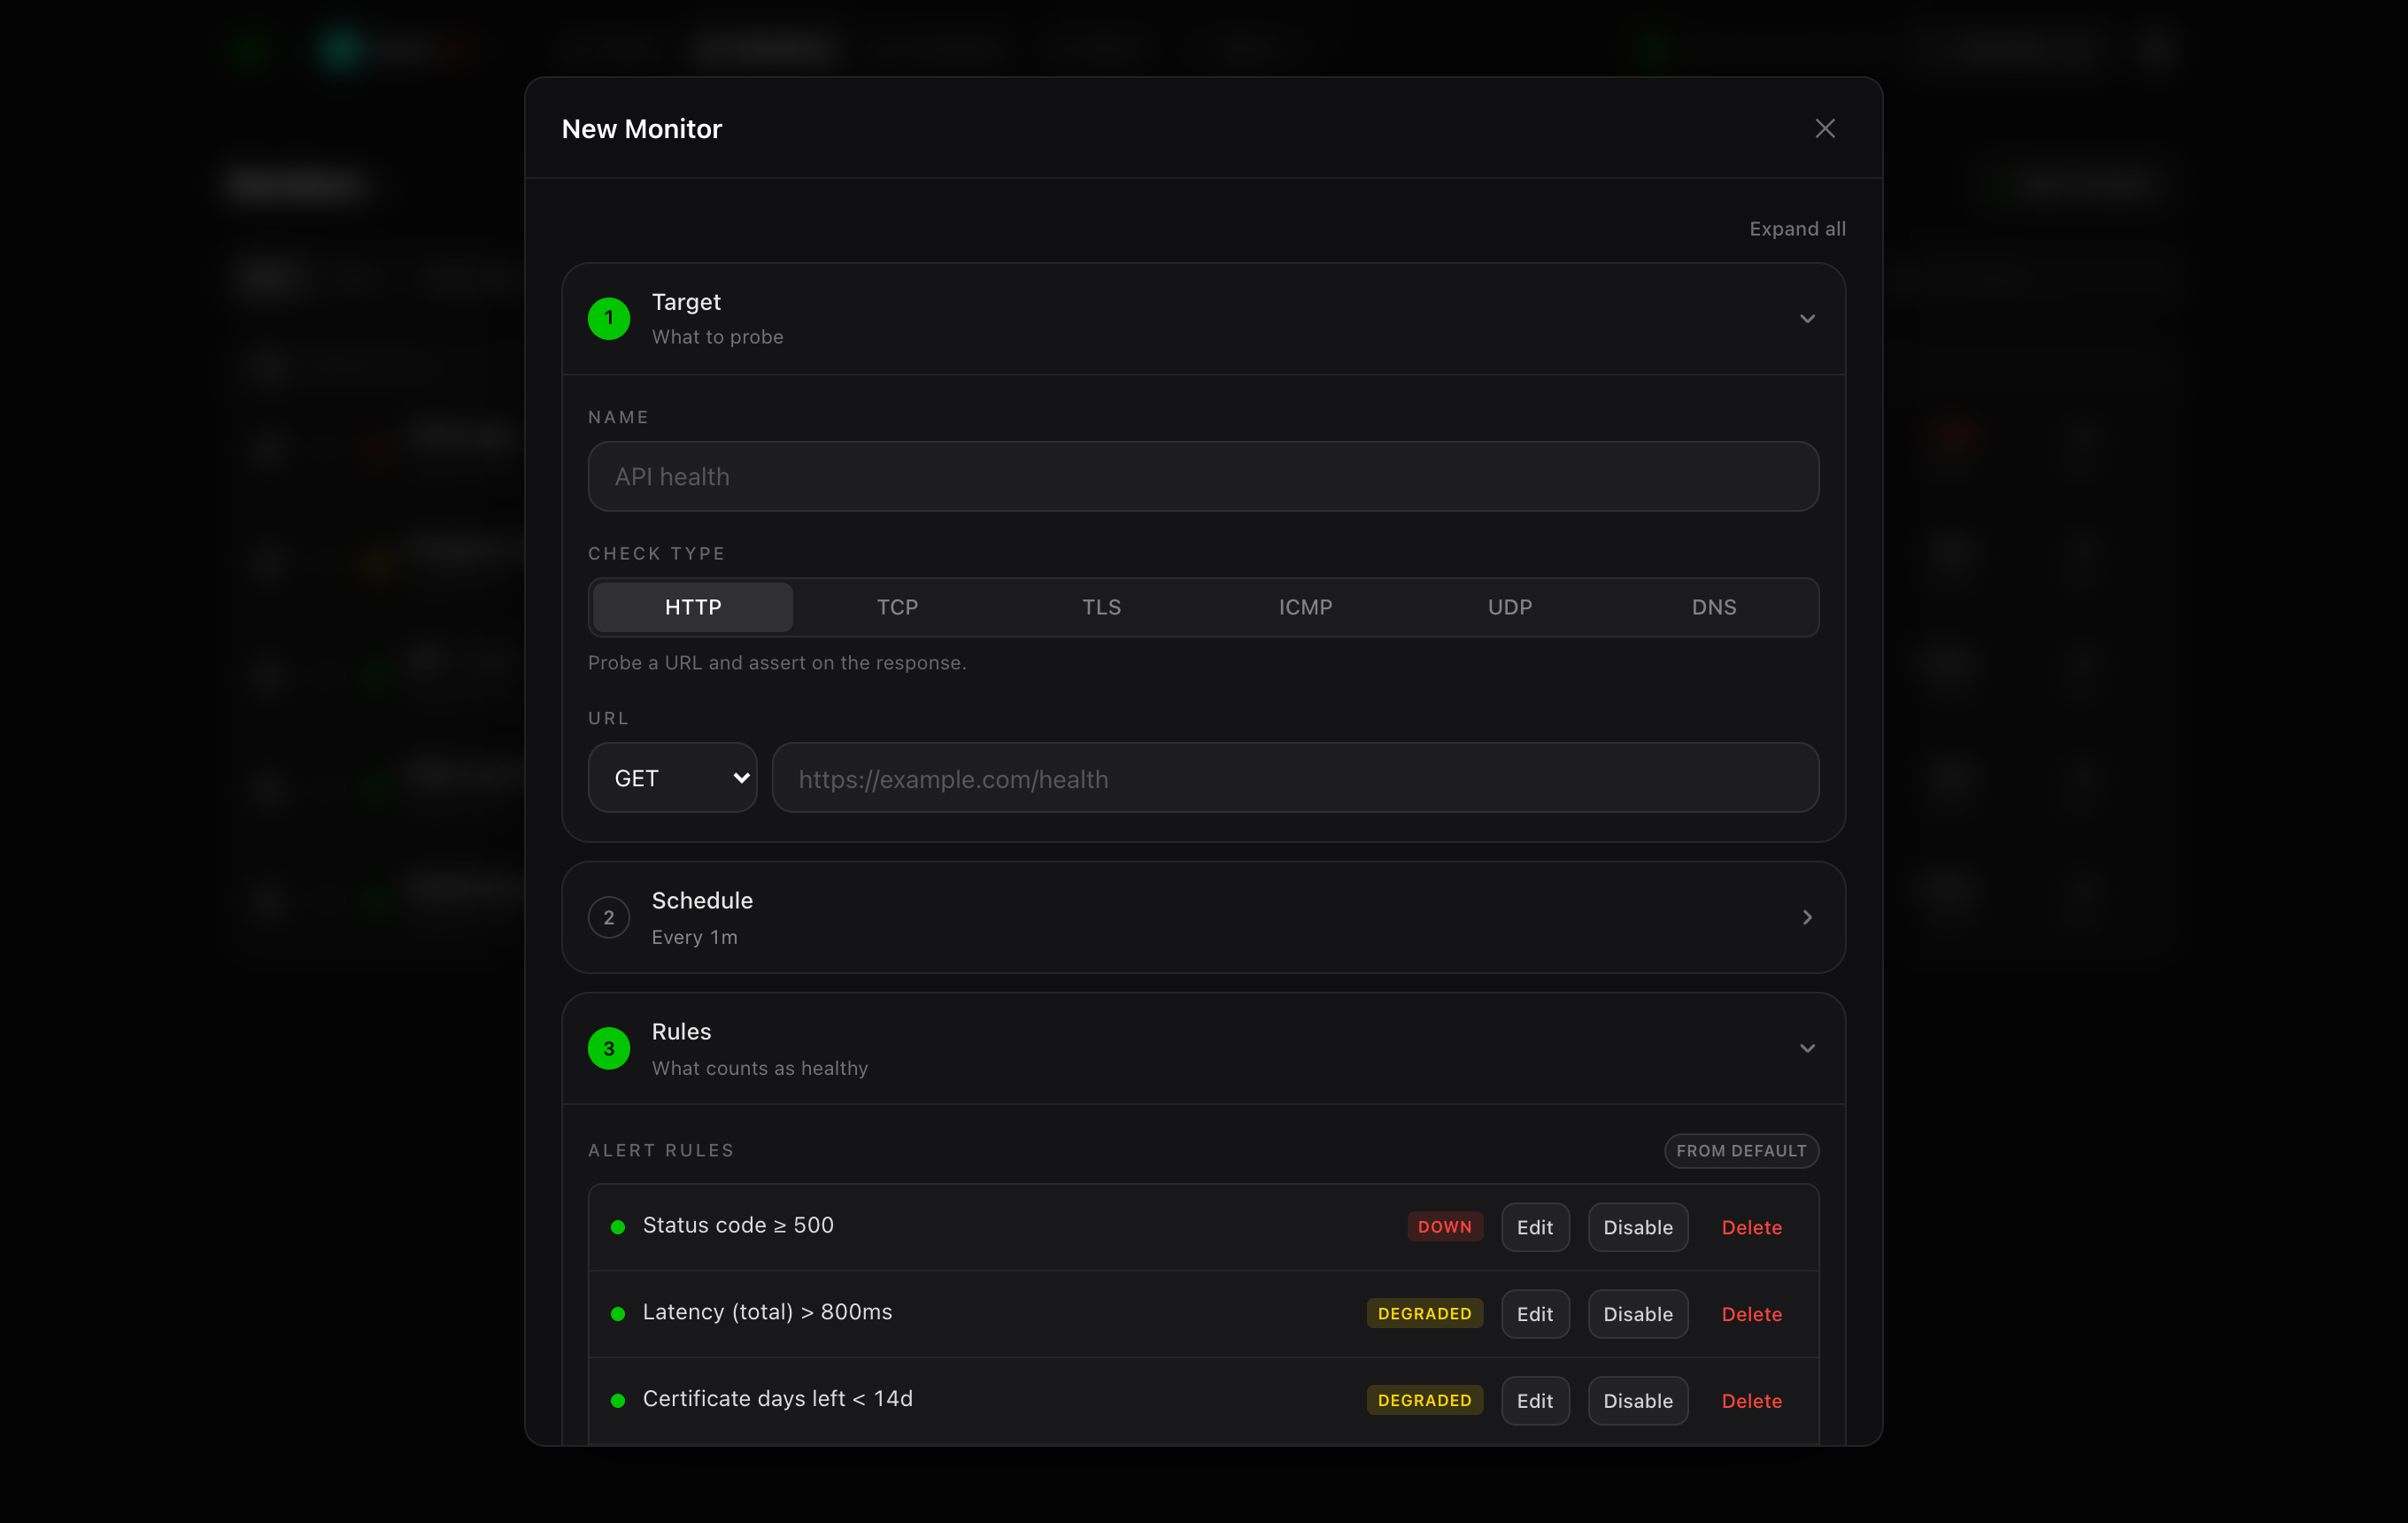
A monitor can watch more than a web page: an API endpoint, a raw TCP host, a DNS record, or an ICMP ping. The defaults are sensible, so create it now and tune it later. See Monitor a site for every option.
3. Read the real status
Open your new monitor from the dashboard:
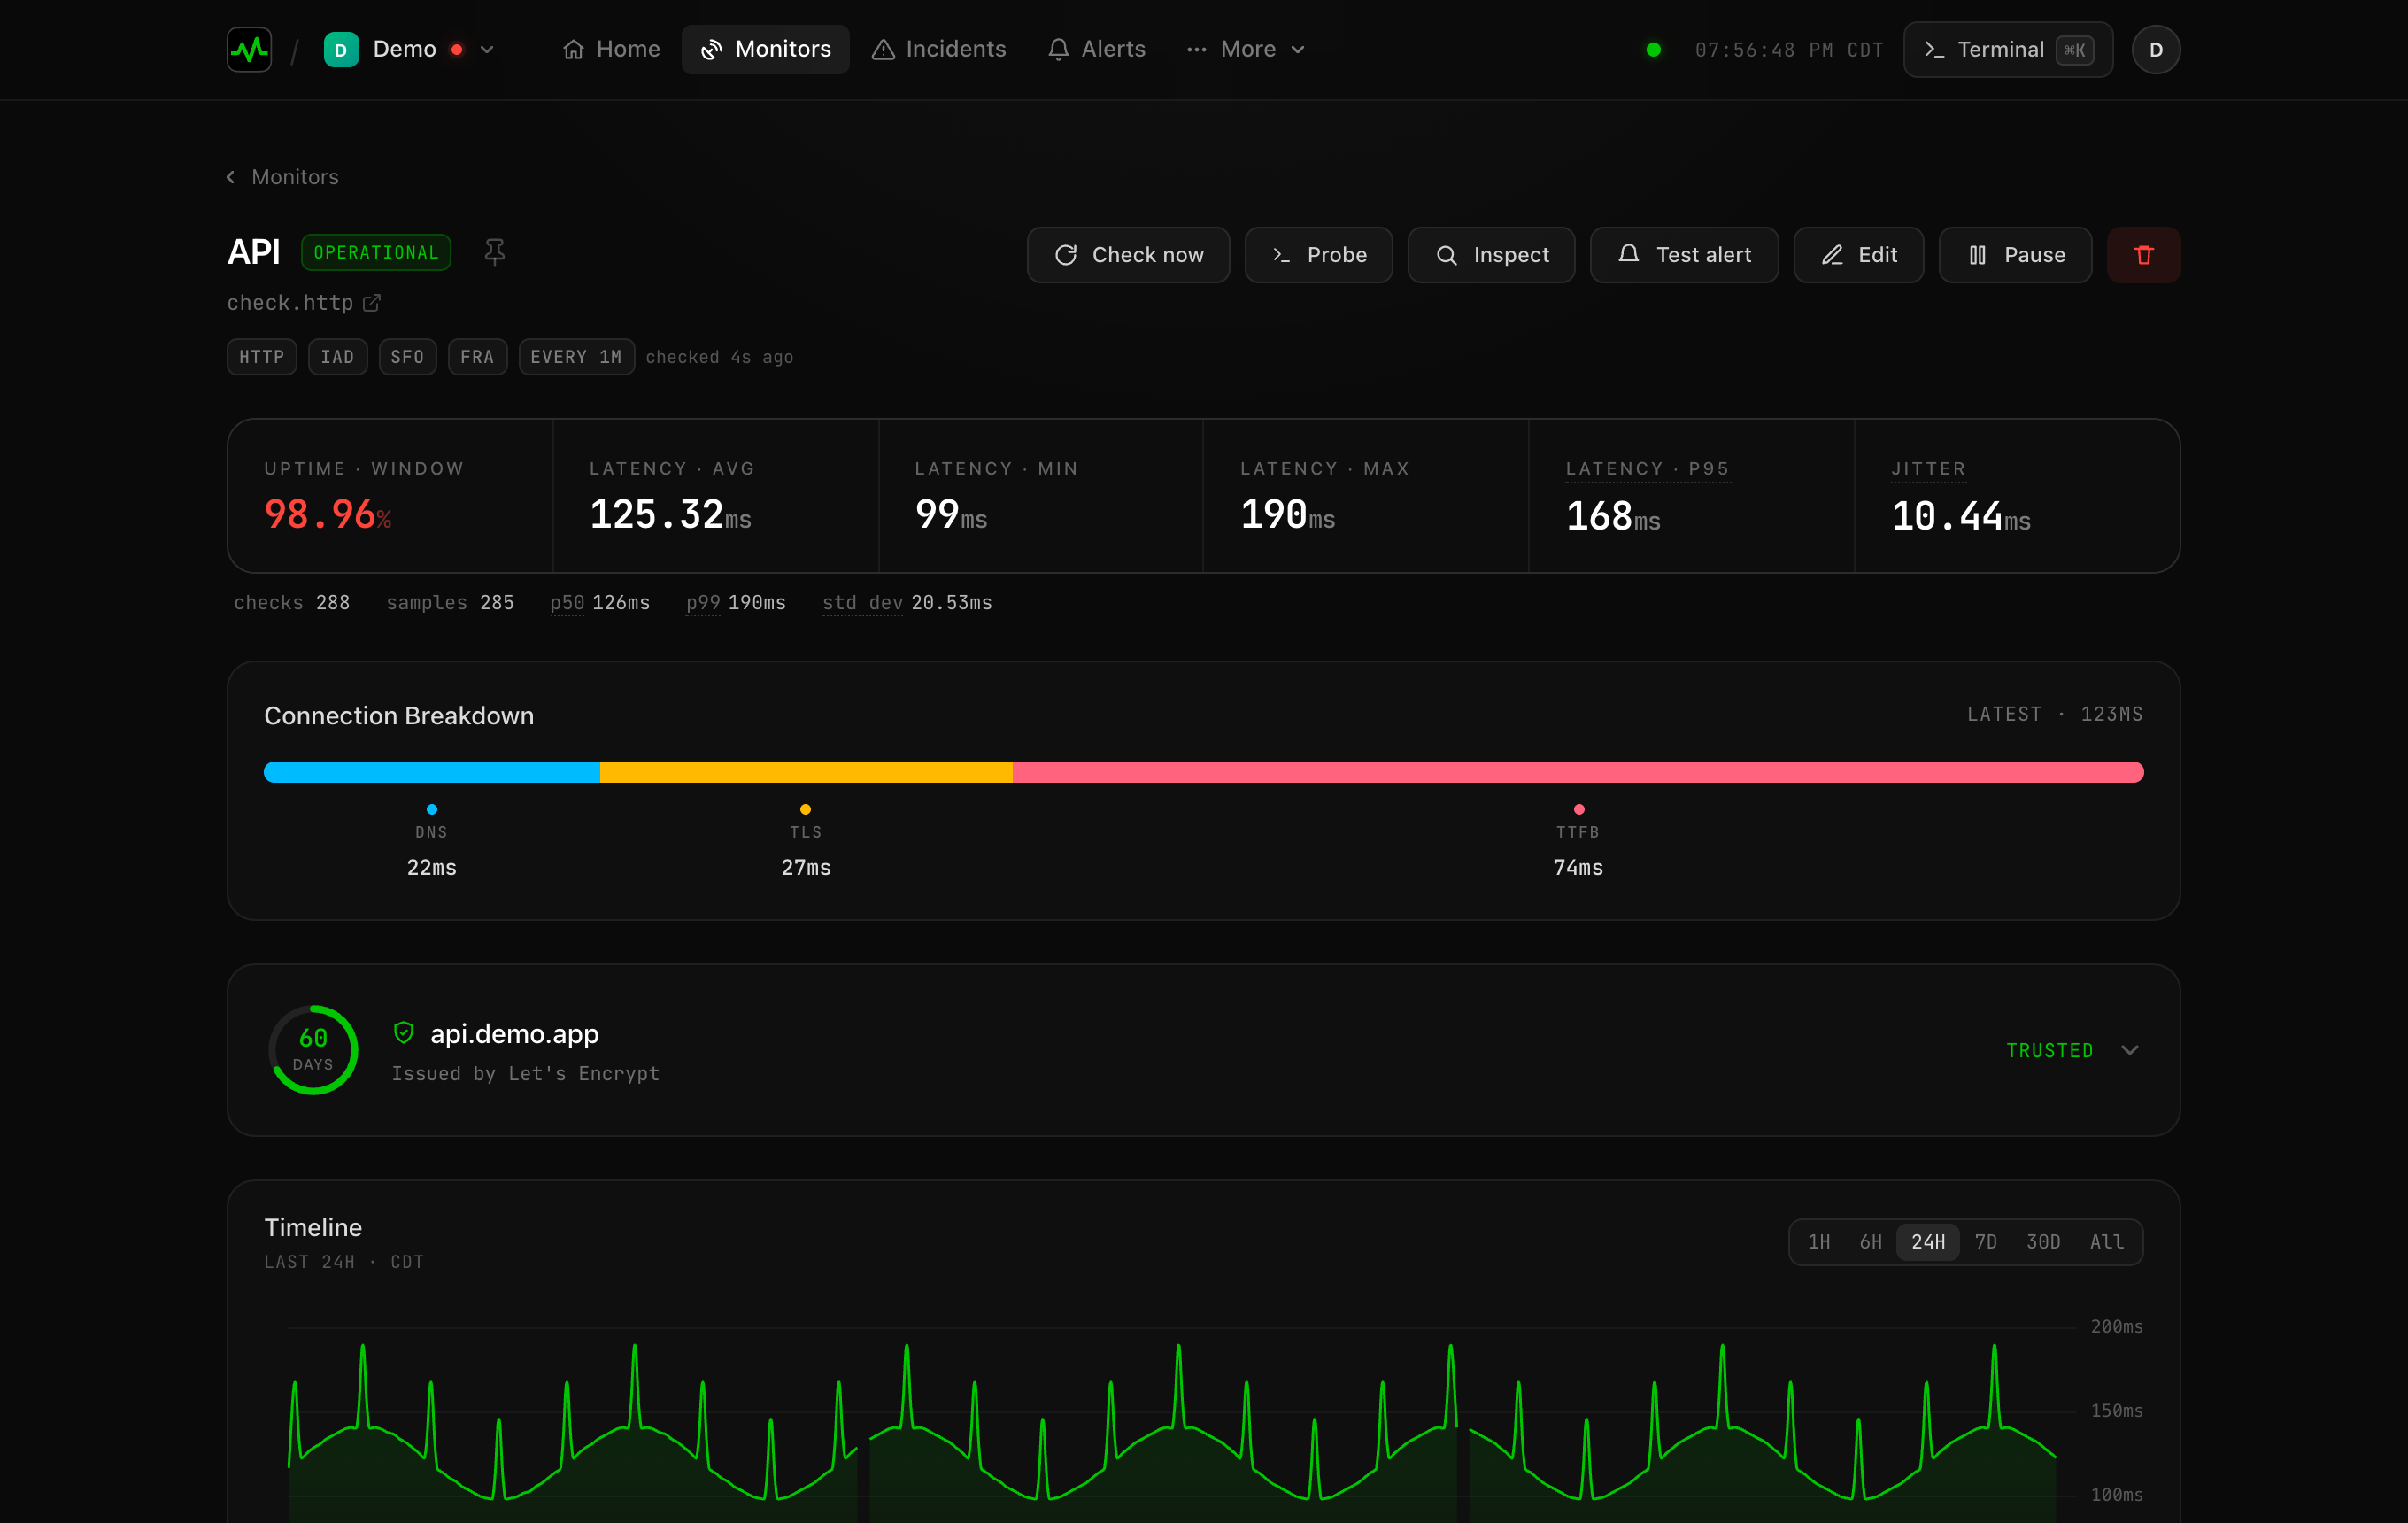
- A live verdict, reconciled from your own checks, the provider's status page, and crowd reports: the real story, not a single lucky ping.
- A latency breakdown (DNS, TLS, time-to-first-byte, transfer), so you know why it's slow, not just that it's slow.
- Uptime, percentiles, and history, so a blip is obvious at a glance.
4. Get alerted
A monitor no one hears about isn't much use. Open Alerts, add a contact, and verify it. latency then tells you the moment something changes, and again when it recovers.
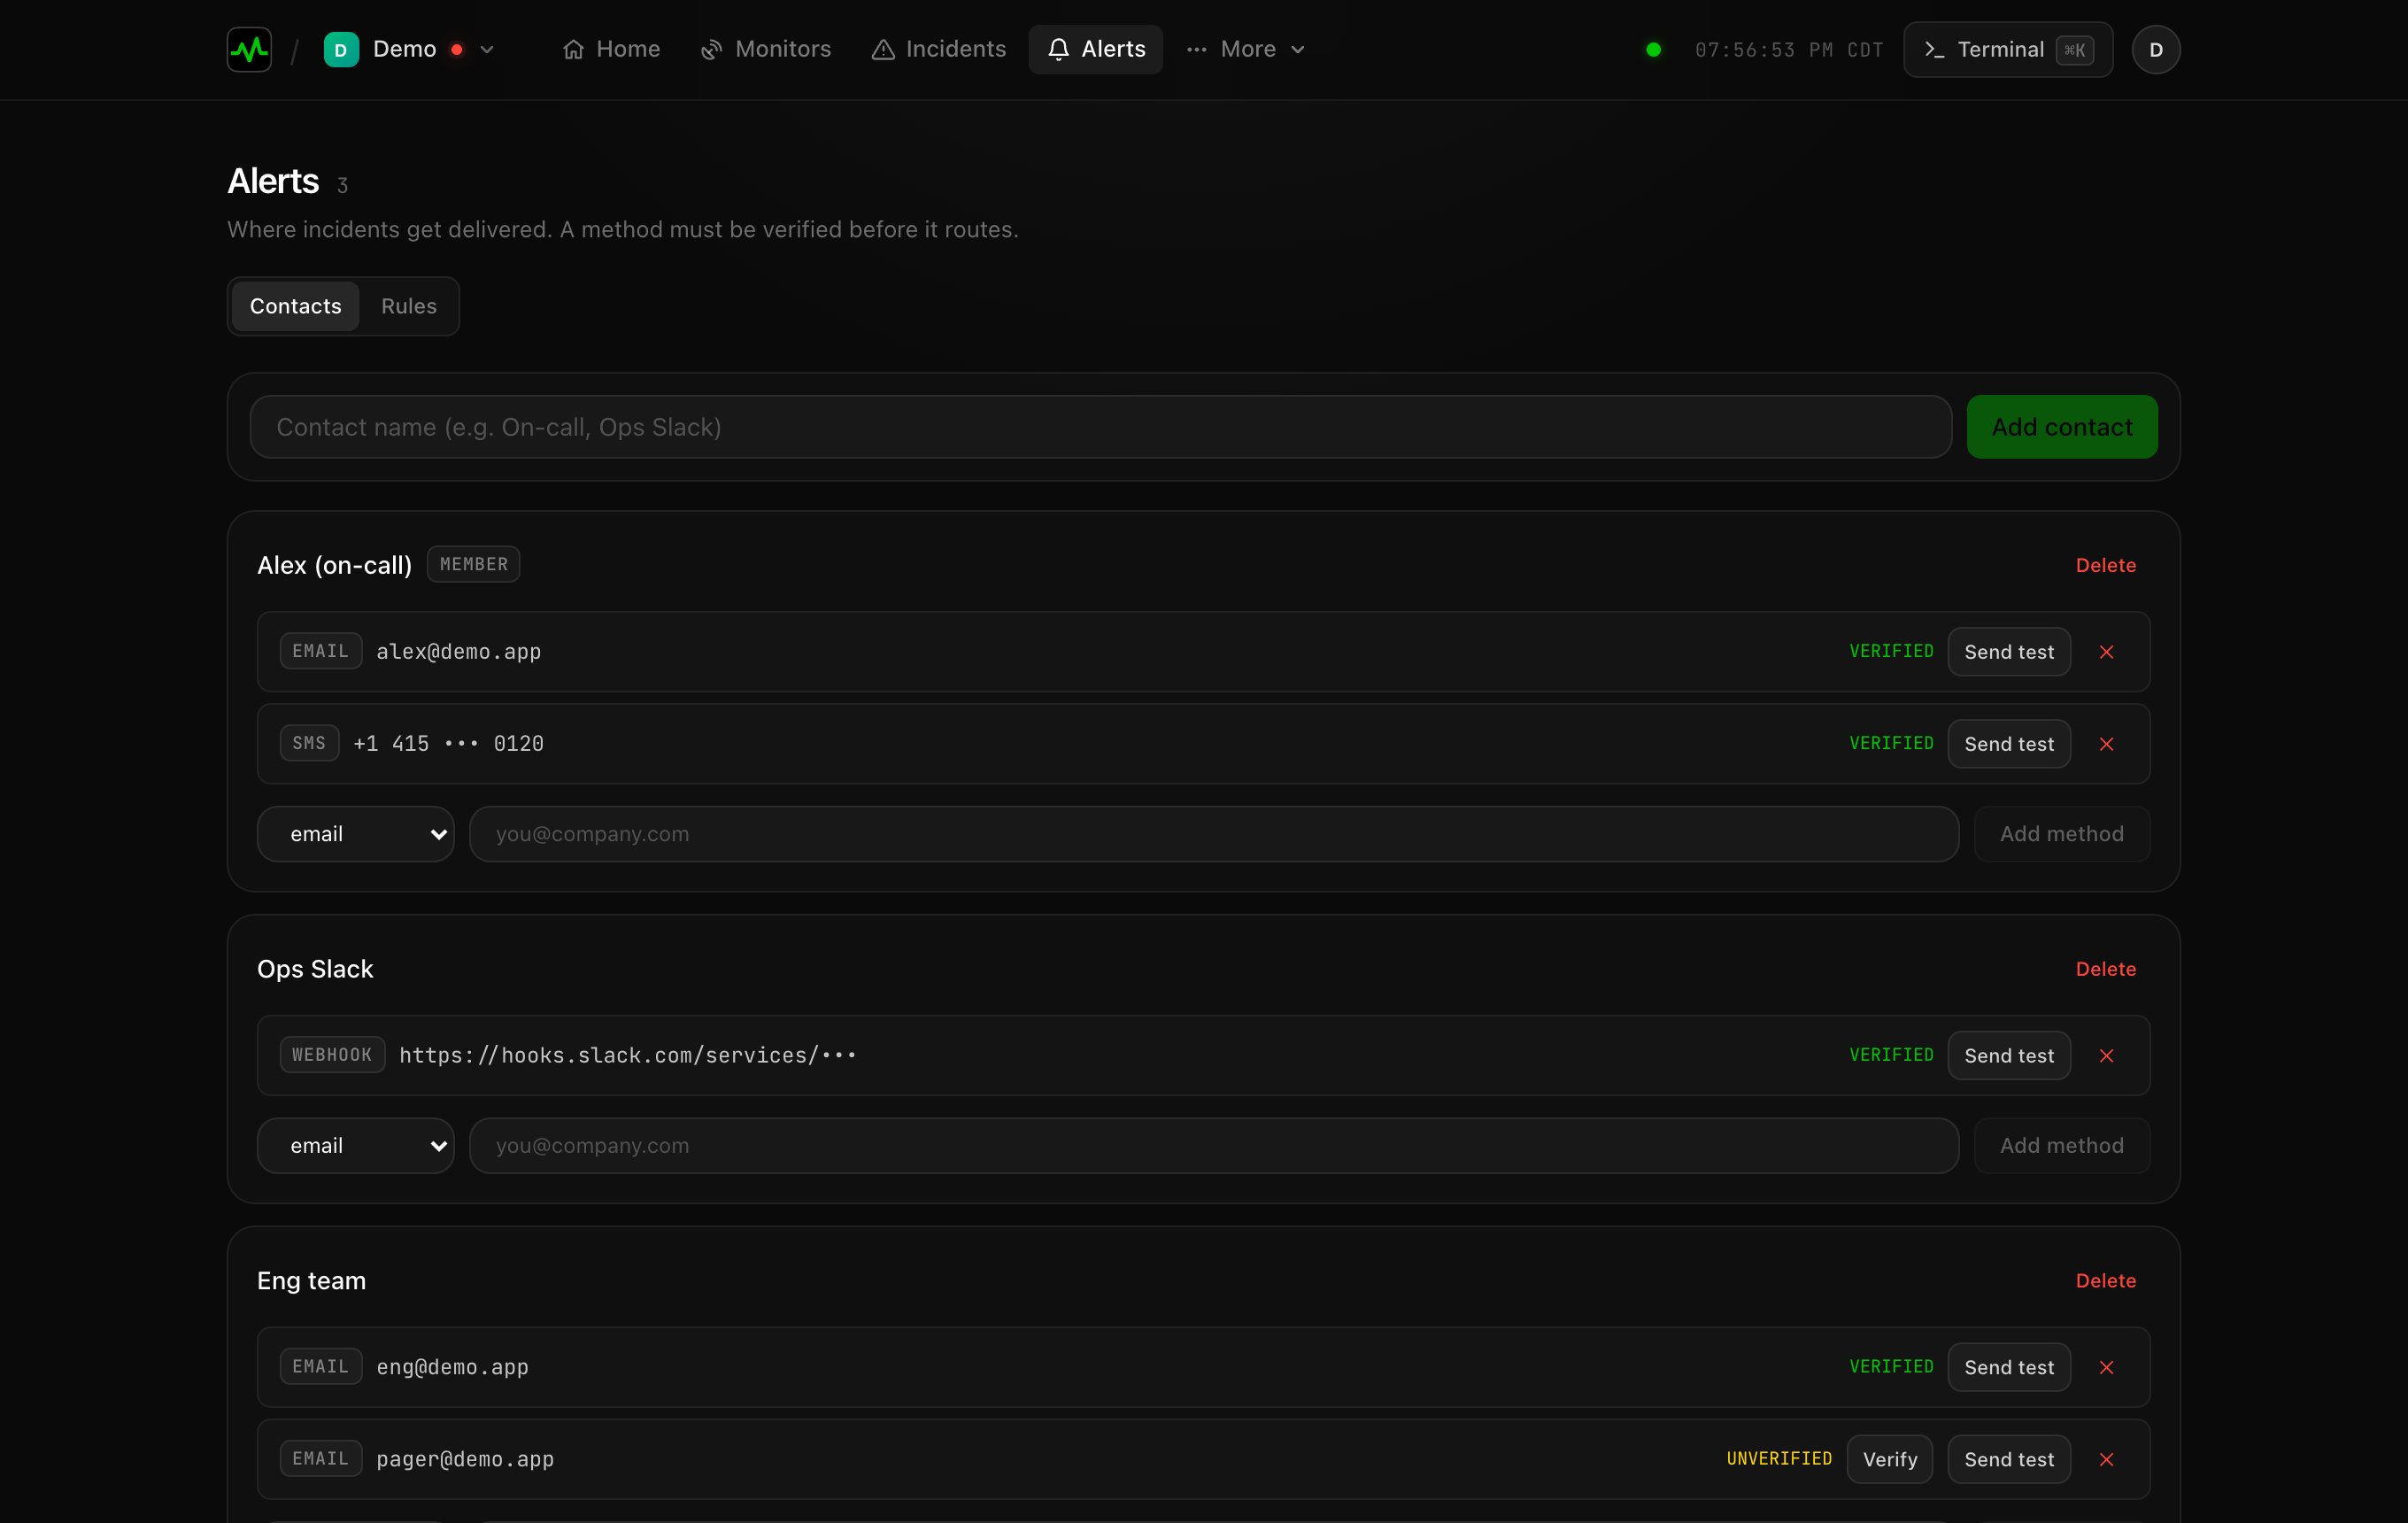
- Email is on every plan and webhooks from Hobby up; SMS, Slack, and Discord are on paid plans.
- By default we confirm a couple of failed checks before opening an incident, so a single flaky request never pages you. Want the very first failure instead? Toggle Alert on first failure on the monitor. Full details in Alerts.
5. Watch what you depend on
Your site rarely goes down alone. Add the services it runs on (Stripe, your CDN, your database host) and we watch them right next to you, so their bad day doesn't blindside yours. Inspect any host on the public inspector.
What next?
- How monitoring works: check types, regions, and how verdicts are reconciled.
- Alerts: contacts, routing, thresholds, and fast-retry.
- Grab the iOS app: your status board in your pocket, with push alerts.
Do you favor the terminal instead?
Our CLI is open-source and a public API will be available soon for everything you see here.